Most buyers ask “how far away can I still see it?” The useful question is actually two questions — how close can people sit, and how large does the wall need to be.
A customer wrote to us last week: “What is the maximum distance at which you can see the picture on a COB 1.56 panel?”
It reads like a simple specification question. It is not — and the way you answer it decides whether the room works for the next ten years.
Pixel pitch sets the minimum viewing distance. Screen size sets the maximum.
Almost every online viewing-distance calculator collapses these into one number. That is why rooms get built with a wall that is razor-sharp for the person in the front row and unreadable for the person at the back. In this article we separate the two properly, and show how to turn them into a decision.
1. Why an LED wall has no “maximum distance” in the optical sense
An LED display does not blur with distance. There is no lens to lose focus, no backlight to bleed, and no polariser to wash out. A light-emitting diode either emits or it does not. Move from two metres to twenty and the image is optically identical — it simply occupies a smaller part of your field of view.
That is a real advantage over LCD and projection, and it is why control rooms, transport hubs and stadium screens can all use the same underlying technology at wildly different scales.
So “maximum distance” is not an optical limit. It is a human-factors limit: at some point the wall is too small in your visual field for the content on it to be legible. That limit depends on four things — the size of the wall, what is being displayed, the ambient light in the room, and the panel technology you chose.
2. The minimum distance: set by pixel pitch
This part is genuinely determined by the pitch, and the industry formulas are stable and widely published:
| Reference distance | Formula (pitch in mm) | What it describes |
|---|---|---|
| Colour-mixing distance | pitch × 500 | Closer than this you resolve the separate R, G and B emitters instead of white |
| Minimum viewing distance | pitch × 1000 | Closer than this the pixel grid becomes visible |
| Optimum viewing distance | pitch × 3000 | The image reads at its sharpest and most comfortable |
Divide the result by 1000 to convert millimetres to metres.
In practical terms the middle row is the one to remember: the minimum viewing distance in metres is roughly equal to the pitch in millimetres.
| Pixel pitch | Colour mixing | Minimum viewing | Optimum viewing |
|---|---|---|---|
| P0.9 | 0.45 m | 0.90 m | 2.7 m |
| P1.25 | 0.63 m | 1.25 m | 3.8 m |
| P1.56 | 0.78 m | 1.56 m | 4.7 m |
| P1.86 | 0.93 m | 1.86 m | 5.6 m |
| P2.5 | 1.25 m | 2.50 m | 7.5 m |
| P3 | 1.50 m | 3.00 m | 9.0 m |
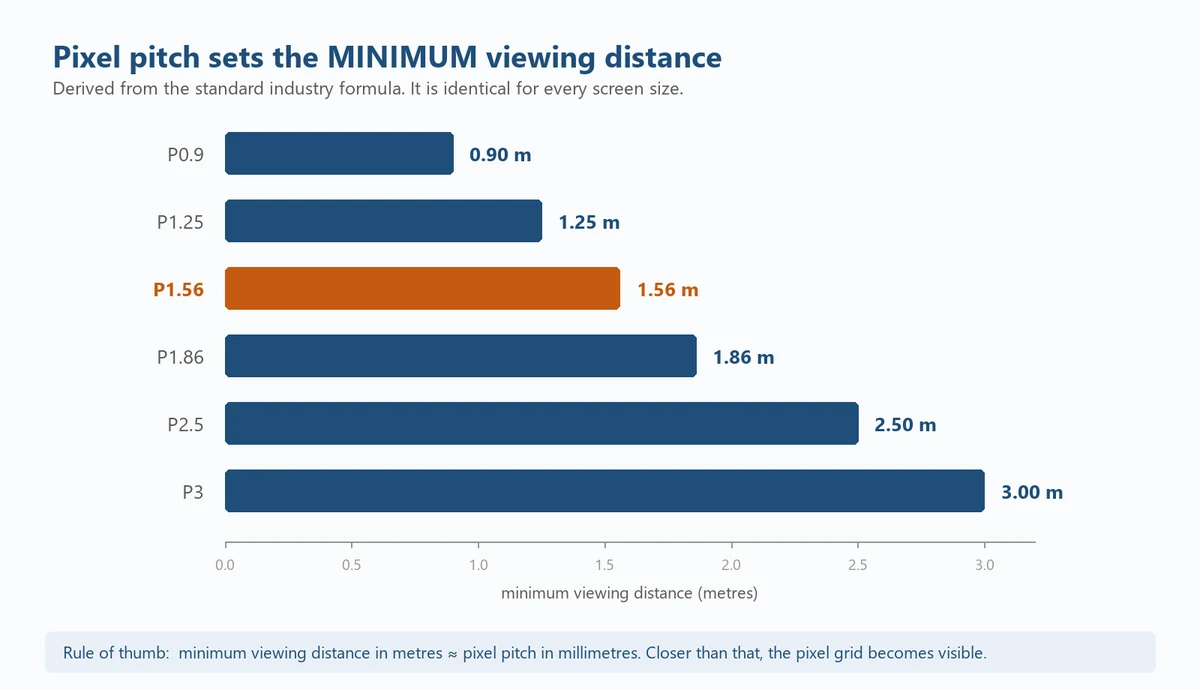
Note what this table does not contain: the size of the screen. Those three distances are identical whether the wall is 110 inches or 220 inches, because they are a property of the pixel grid alone. A P1.56 panel looks the same up close no matter how big it is — there is simply more of it.
The formula is also a rule of thumb, not a law. It marks the point where the pixel structure becomes just about invisible. A well-built fine-pitch panel — and especially a COB panel — still looks perfectly acceptable somewhat inside that line, for reasons we cover in section 5.
3. The maximum distance: set by screen size
Here the logic flips. Once the image is optically perfect at any distance, the only question left is whether the audience can comfortably take it in. AV system designers express that as a multiple of the image height, and the criteria most commonly used are:
| Viewing position | Distance from the wall | Typical content |
|---|---|---|
| Closest comfortable viewer | from 2 × image height | Anyone, at any content type |
| Farthest viewer — video and presentation | up to 6 × image height | Brand film, live video, dashboards glanced at rather than read |
| Farthest viewer — text and data | up to 4 × image height | Spreadsheets, financial models, engineering drawings, small body text |
Applying that to a 16:9 wall gives the numbers most rooms are actually designed around:
| Wall size | Image height | Closest viewer | Farthest — video | Farthest — text & data |
|---|---|---|---|---|
| 108″ | 1.35 m | 2.7 m | 8.1 m | 5.4 m |
| 136″ | 1.69 m | 3.4 m | 10.1 m | 6.8 m |
| 163″ | 2.03 m | 4.1 m | 12.2 m | 8.1 m |
Sixteen-by-nine aspect ratio; distances rounded to one decimal place.
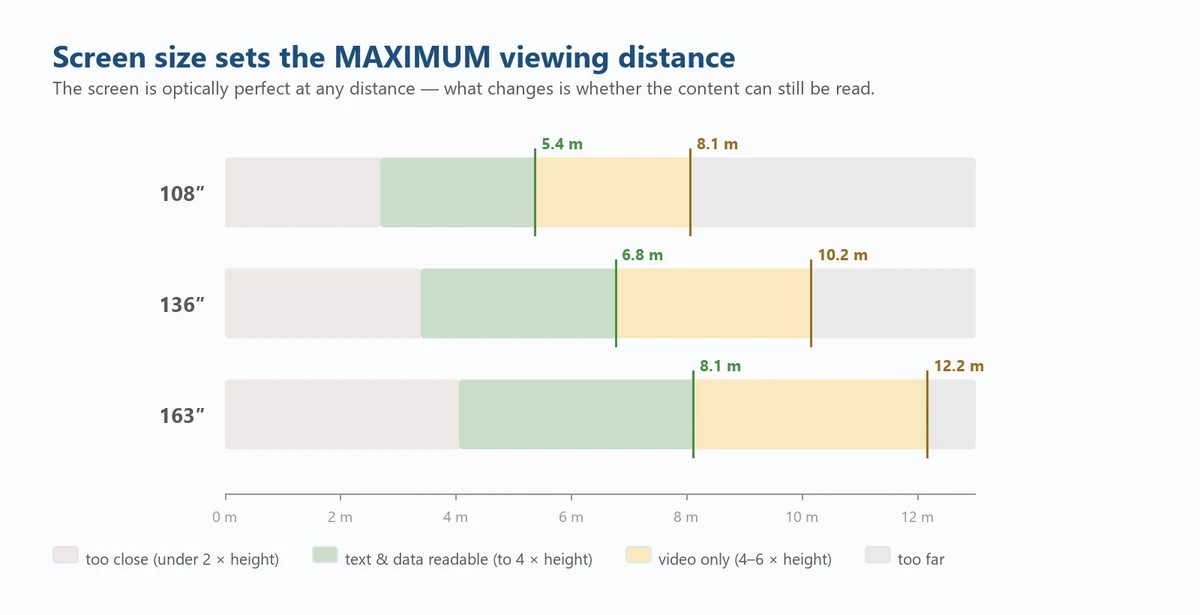
The gap between the last two columns is where most projects get into trouble. A wall sized for watching video is frequently a size too small for reading a spreadsheet from the back of the same room. If there is any chance the room will be used for live data review, plan for the text-and-data column from day one — retrofitting a larger wall later costs far more than specifying it correctly now.
4. Measure these two numbers before you specify anything
Before talking about pitch at all, take a tape measure into the room and write down two distances:
- Closest viewer — from the wall to the nearest seat. This decides your maximum usable pitch.
- Farthest viewer — from the wall to the last row. This decides your minimum screen size.
Only one of those four decisions is about pitch. The other is about size, and size is usually the more expensive of the two to get wrong.
A worked example
A boardroom where the nearest chair is 2.2 m from the wall and the back row is 7 m away, used mainly for presentations with occasional spreadsheet review.
- Pitch: At 2.2 m, P2.5 would already be inside its 2.5 m minimum — too coarse. P1.86 (1.86 m minimum) is safe and is the economical choice. P1.25 buys extra headroom, but on a wall this size it is often money that would be better spent on the back row.
- Size: The back row at 7 m needs an image at least 7 ÷ 4 = 1.75 m tall to satisfy the text-and-data criterion. A 136″ wall is 1.69 m tall — comfortable to 6.8 m for data and 10.1 m for video. It clears the video case easily and misses the data case by about 6 cm of image height.
Which leaves a judgement call rather than a formula. If spreadsheet review is an occasional event and the rear chairs are not pinned to the wall, P1.86 at 136″ is the right spend. If dense data is a daily routine, step up to 163″ — 2.03 m of image height, comfortable to 8.1 m for data — and keep P1.86. Note that neither answer came from the pitch. Both came from the back row.
5. Four factors that quietly change the answer
Ambient light and surface reflectance
A viewing-distance calculation assumes you can actually see contrast. In a brightly lit lobby or a glass-walled meeting room, the dominant factor is how much light the panel surface bounces back at the audience. Standard SMD panels reflect 15–25% of ambient light; a COB panel reflects roughly 2–5%. Under the same lighting, the COB wall holds its black level and the SMD wall turns grey — which effectively shortens the distance from which either can be read.
Viewing angle
Distance tables are usually drawn on the centre axis. Real rooms are not. A seat 30° off-axis sees a display at reduced contrast and shifted colour. SMD panels typically specify 140–160°; COB panels commonly specify 170° or more, which keeps the side seats usable and effectively widens the usable room.
Whether the wall will be filmed
If the display appears on camera — broadcast, hybrid meetings, esports, XR stages — the constraint is no longer the eye but the shutter. A 3,840 Hz panel is the accepted baseline for filmed content; 7,680 Hz exists for slow-motion capture, where frame times are short enough that a lower refresh shows up as banding. It is worth being honest here: for a plain meeting room, 3,840 Hz is enough, and paying for 7,680 Hz buys you nothing you will notice.
Mounting height
A wall hung too high forces the front row to look upwards, which is uncomfortable well before any pixel becomes visible. Keep the bottom edge close to seated eye level and let the size calculation do the rest.
6. Why COB, GOB and SMD change the viewing-distance answer
Buyers often treat “which pitch” and “which packaging” as separate decisions. They are not. The packaging decides how much contrast survives the room lighting, and contrast is what determines whether the content is legible — at any distance.
| Packaging | Surface reflectance | Typical native contrast | Typical viewing angle |
|---|---|---|---|
| White-face SMD | 15–25% | 3,000–5,000:1 | 140–160° |
| Black-face SMD | 6–12% | 1,500–5,000:1 | 140–160° |
| GOB | in between | approx. 6,000:1 | approx. 160° |
| COB | 2–5% | up to 20,000–25,000:1 | 170° or more |
Native contrast is measured on a full-black field in a dark room. It is the number to quote, and the test condition should always be stated alongside it.
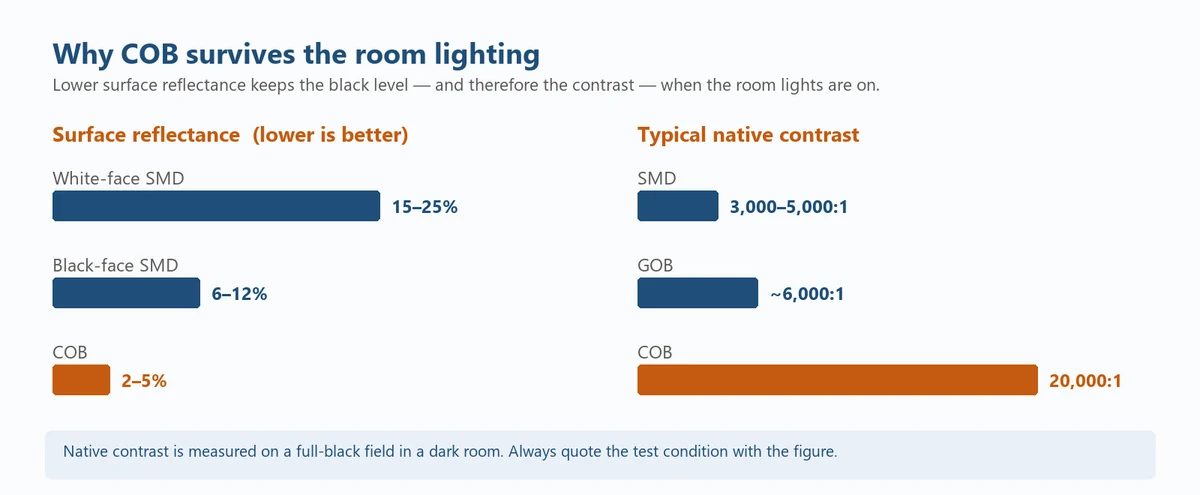
Three practical consequences for viewing distance:
- It looks acceptable closer. COB mounts bare chips under a continuous black coating with no package outline around each pixel. There is no reflective cup and no visible grid, so the pixel structure is less apparent at close range. In practice a COB wall can be viewed somewhat closer than an SMD wall at the same pitch.
- It stays readable further. With 2–5% reflectance rather than 15–25%, the image keeps its depth when the room lights are on, so the audience can sit further back and still read it.
- The room is wider. A 170°-plus viewing angle means the usable width of the room is wider — seats that would be marginal against an SMD wall are fine against a COB wall.
7. A practical shortcut for common rooms
If you want a starting point before doing the arithmetic, these combinations cover most of what we are asked to quote. Treat them as a first guess to be confirmed by the two measurements in section 4, not as a specification.
| Room type | Typical pitch | Typical size | Why |
|---|---|---|---|
| Small boardroom, closest seat under 3 m | P1.25–P1.56 | 108″–136″ | Fine pitch protects the front row; room is small so the wall can be too |
| Large boardroom or training room, 3–6 m | P1.56–P1.86 | 136″–163″ | Back row drives size; pitch can relax |
| Control room or operations centre | P1.25–P1.5 | 163″ and up, often multi-screen | Dense data, viewers seated at fixed consoles |
| Lobby, retail, brand wall | P1.86–P2.5 | whatever the wall allows | Seen in passing and in ambient light — contrast and brightness matter more than pitch |
| Broadcast studio, XR stage, esports | P1.5–P2.5 | large, often curved | Camera is the client: high refresh and no scan lines |
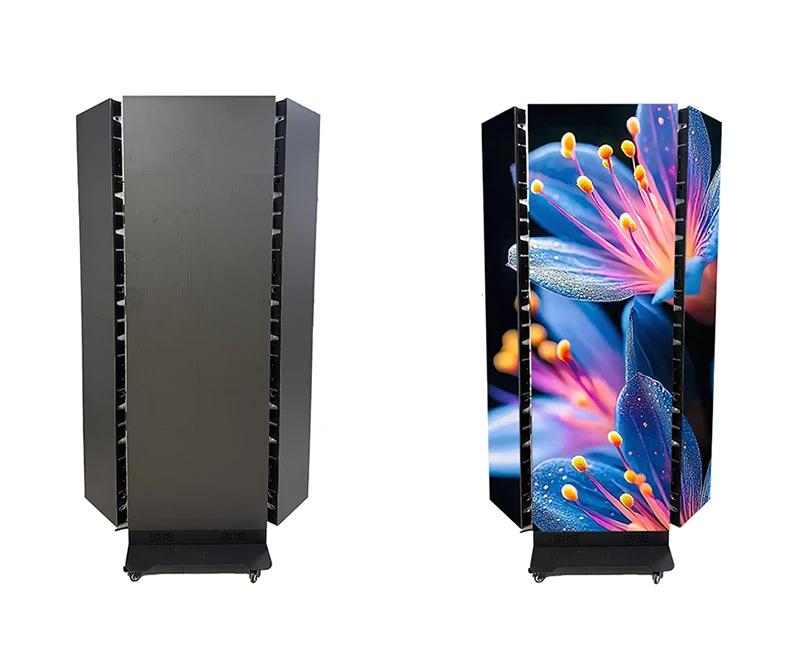
| Narrow space, portrait format | P1.86 | 640 × 1920 mm poster | Freestanding poster displays suit lobbies and entrances |
8. How RioTouch builds for this decision
We design around the two-variable problem rather than around a single headline pitch, because that is how rooms are actually specified.
One cabinet, one aspect ratio, three sizes
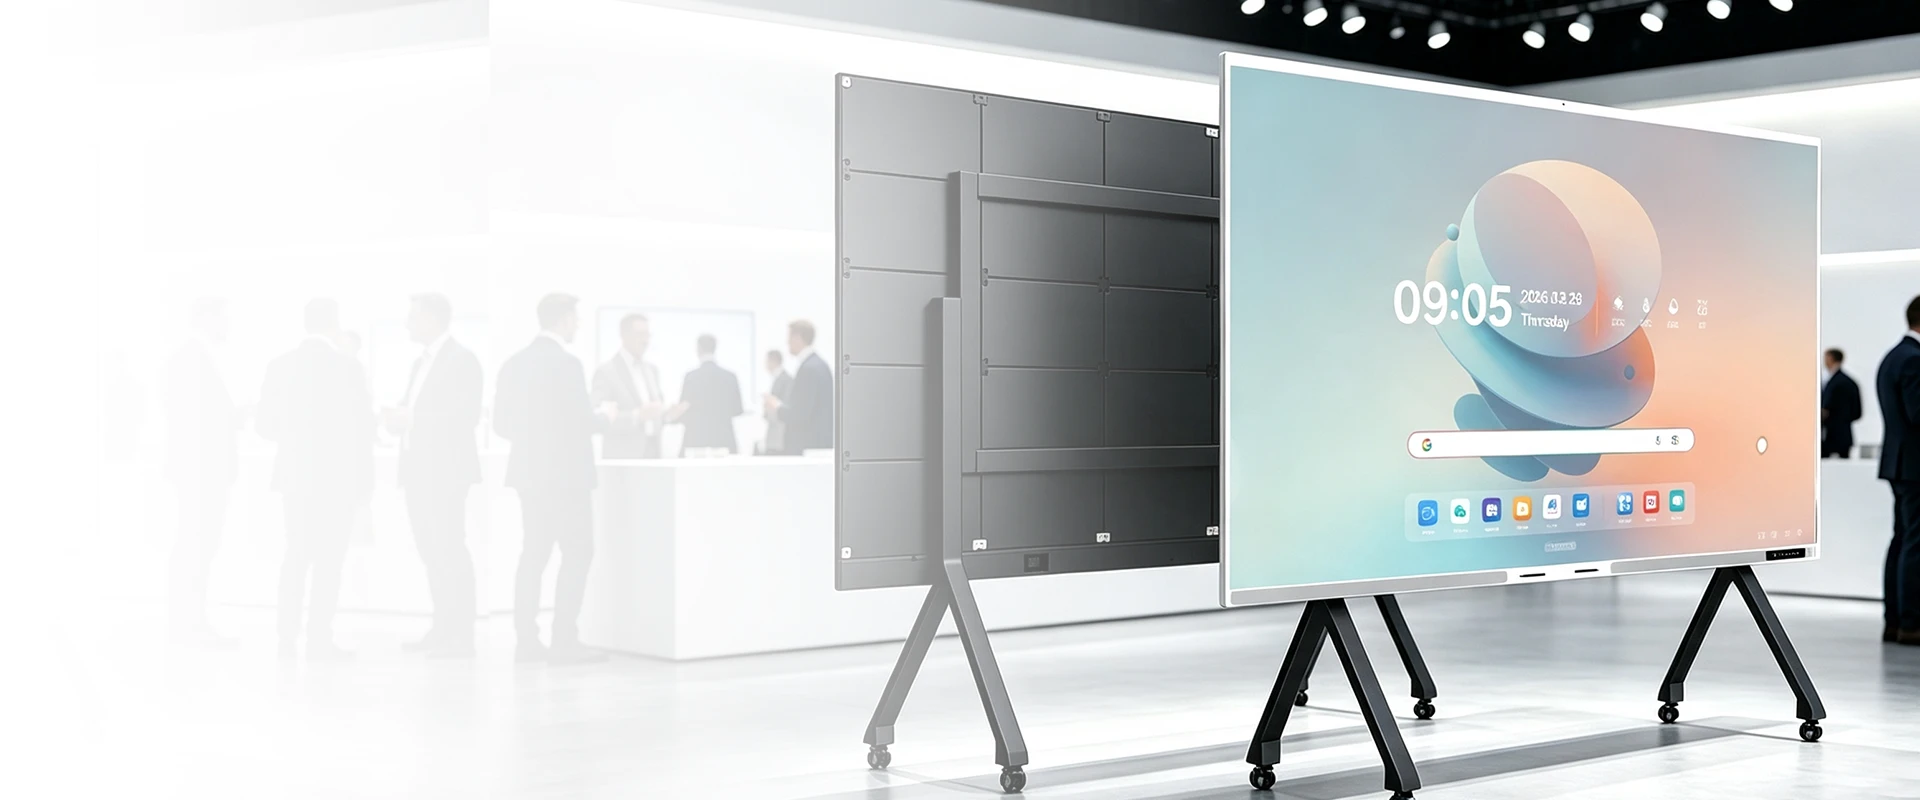
Every RioTouch LED splicing wall is built from the same 600 × 337.5 mm die-cast aluminium cabinet — a true 16:9 tile. Because the tile is exactly 16:9, the wall is 16:9 at any size, with no custom aspect ratio and no letterboxing, and it maps cleanly onto a standard video source.
That gives three sizes on one platform:
| Wall | Dimensions | Cabinet count | Resolution at the 2K pitch |
|---|---|---|---|
| 108″ | 2,400 × 1,350 mm | 16 (4 × 4) | 1,920 × 1,080 at P1.25 |
| 136″ | 3,000 × 1,687.5 mm | 25 (5 × 5) | 1,920 × 1,080 at P1.5625 |
| 163″ | 3,600 × 2,025 mm | 36 (6 × 6) | 1,920 × 1,080 at P1.875 |
Each size can be driven to exactly 1080p by selecting the matching pitch — no scaling, no custom timing, no video processor required for a 2K source.
That last point matters more than it sounds. A wall that lands on a standard timing works with any laptop, and it will still work when the control system is replaced in five years’ time.
COB as standard, not as an upgrade
Our fine-pitch range is COB throughout, with a native contrast ratio of 20,000:1 measured on a full-black field in a dark room, a viewing angle of 170° or more, and a surface reflectance of 2–5%. In daylight-flooded lobbies and glass-walled boardrooms, that is the difference between a wall that reads and a wall that looks washed out.
7680 Hz where it earns its keep
Where the wall will be filmed, we specify 7,680 Hz refresh — for broadcast, XR, esports and high-speed capture. Where it will not, we will tell you so, because paying for refresh you never use is not a good way to spend a budget.
And a poster range for the spaces a wall will not fit
For entrances, elevator lobbies and narrow retail bays we build a 640 × 1,920 mm portrait LED poster at P1.86 with GOB protection — same engineering discipline, different form factor.
9. A checklist to take into the meeting
- Distance to the closest seat — sets your maximum usable pitch.
- Distance to the farthest seat — sets your minimum screen size.
- Will anyone need to read small text or dense data from the back? If yes, use 4 × image height, not 6 ×.
- How bright is the room, and which way do the windows face?
- Will the wall ever appear on camera? If yes, plan for 3,840 Hz minimum.
- Are there seats far off-axis? Check the viewing angle, not just the pitch.
- How high will the wall be mounted, and does the front row have to look up?
- What resolution does the source actually output — and does the wall land on it exactly?
Send us your room, not your specification
Tell us the room length, the closest and farthest seat, the lighting and what will be on the screen. We will come back with the pitch and the size that fit — and tell you honestly if a cheaper configuration does the job just as well.
Daisy@RioTouch.com · www.RioTouch.com
RioTouch — LED displays engineered around the room they live in.
About the author
Daisy works with the RioTouch LED display team, helping integrators and end users match a room to a wall — usually by starting with the tape measure rather than the datasheet. She can be reached at Daisy@RioTouch.com.
Specifications quoted in this article are typical industry values and, where they relate to RioTouch products, are subject to our published datasheets. Contrast ratio is a native measurement taken on a full-black field in a dark room; viewing angle and reflectance figures are typical values. Always confirm final figures against the project configuration sheet.