How to Capture a Device Log from an Interactive Flat Panel
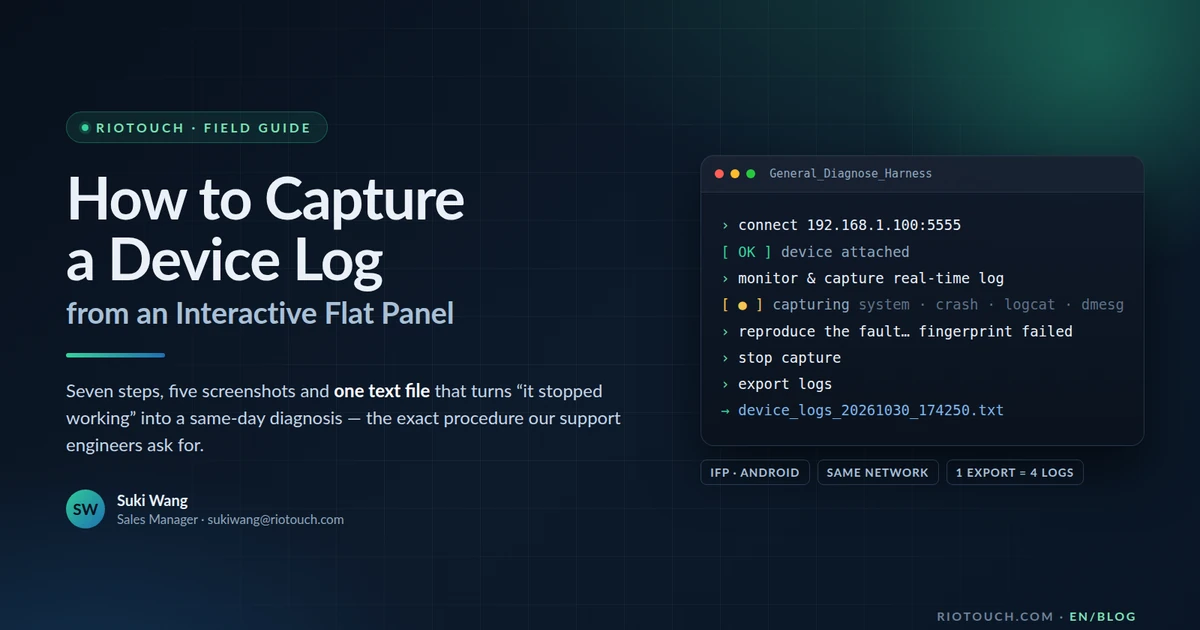
When an interactive flat panel misbehaves — a fingerprint reader that rejects a finger it registered five minutes earlier, a teaching app that freezes after login, touch that stops responding in one corner of the glass — a screenshot shows what you saw, but it cannot show why. A real-time log captured while the fault is happening is usually what turns a two-week guessing game into a same-day fix. This is the exact procedure our support engineers ask customers to follow, with the screenshots from the tool itself, written as a checklist you can hand to whoever is standing in front of the panel.
1. What you need before you start
Nothing here is exotic, and nothing requires opening the panel. The only hard requirement is that the Windows PC running the diagnosis tool and the panel sit on the same local network while you reproduce the fault.
| Item | Requirement |
|---|---|
| Windows PC | Any recent Windows machine. It runs the diagnosis tool, so it needs no special hardware. |
| Diagnosis tool | General_Diagnose_Harness.exe, downloaded and unzipped on that PC. |
| Network | PC and panel joined to the same router or access point — not a guest network, not a phone hotspot. |
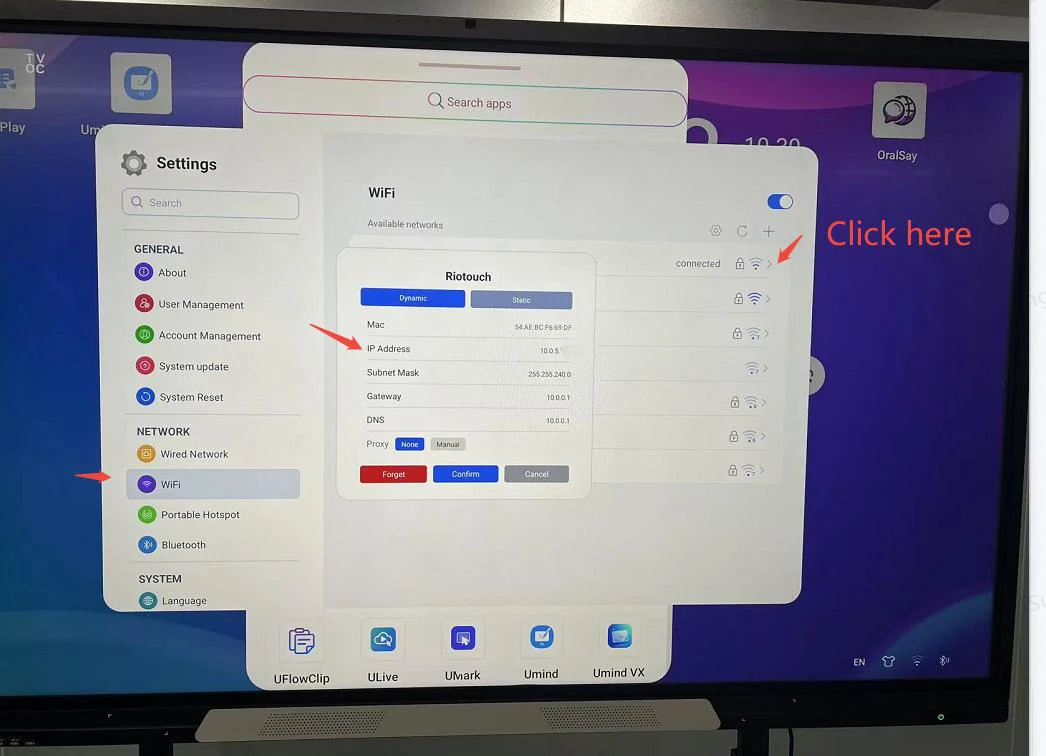
| Panel IP address | Read on the panel: Settings → Wi-Fi → tap the connected network. |
| The failing app | Installed on the panel, so the fault can be reproduced on demand. |
| Time | 15–20 minutes, with the panel in front of you and the fault reproducible. |
2. The seven steps
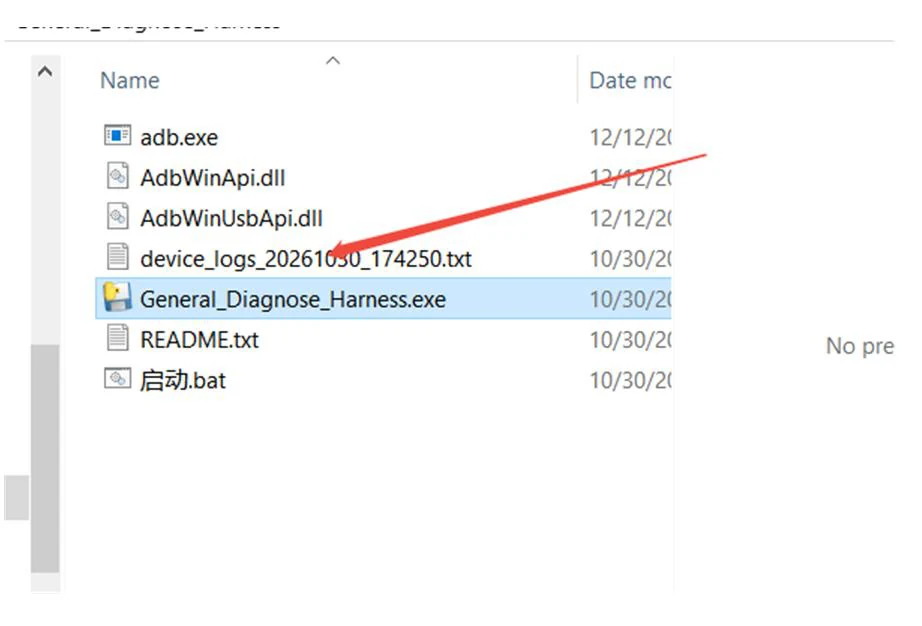
Step 1. Download the tool to the PC and unzip it. Keep the folder — the exported log is written into the same directory, which makes it easy to find afterwards. The unzipped folder holds General_Diagnose_Harness together with adb and its two support DLLs, a README and a start-up batch file; nothing else needs installing.
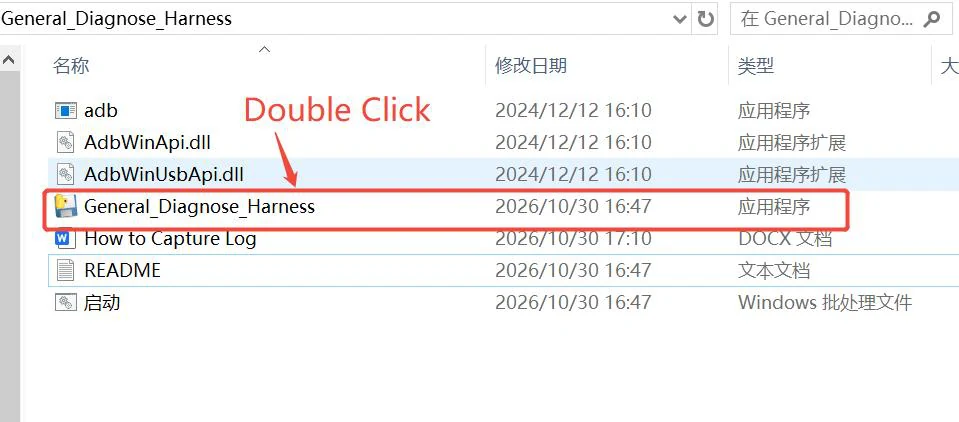
Step 2. Confirm the PC and the interactive touch screen are connected to the same Wi-Fi network. This is the step that fails most often in schools and offices, because the laptop is quietly on a guest network or a mobile hotspot.
Step 3. Double-click General_Diagnose_Harness.exe and install it on the PC.
Step 4. On the panel, open Settings → Wi-Fi, tap the connected network and note the IP address it was assigned. The panel shows the address, subnet mask, gateway and DNS for that connection — copy the IP exactly, because a single wrong digit produces a connection error that looks like a tool problem.
Step 5. Open the Harness window and give it the connection instruction. It accepts a plain sentence in English or Chinese, for example “Connect to <panel IP> and monitor and capture the real time log”, and it reports the device as attached once the panel answers. The harness is an adb front end, so the underlying address carries port 5555 — connect <panel IP>:5555.
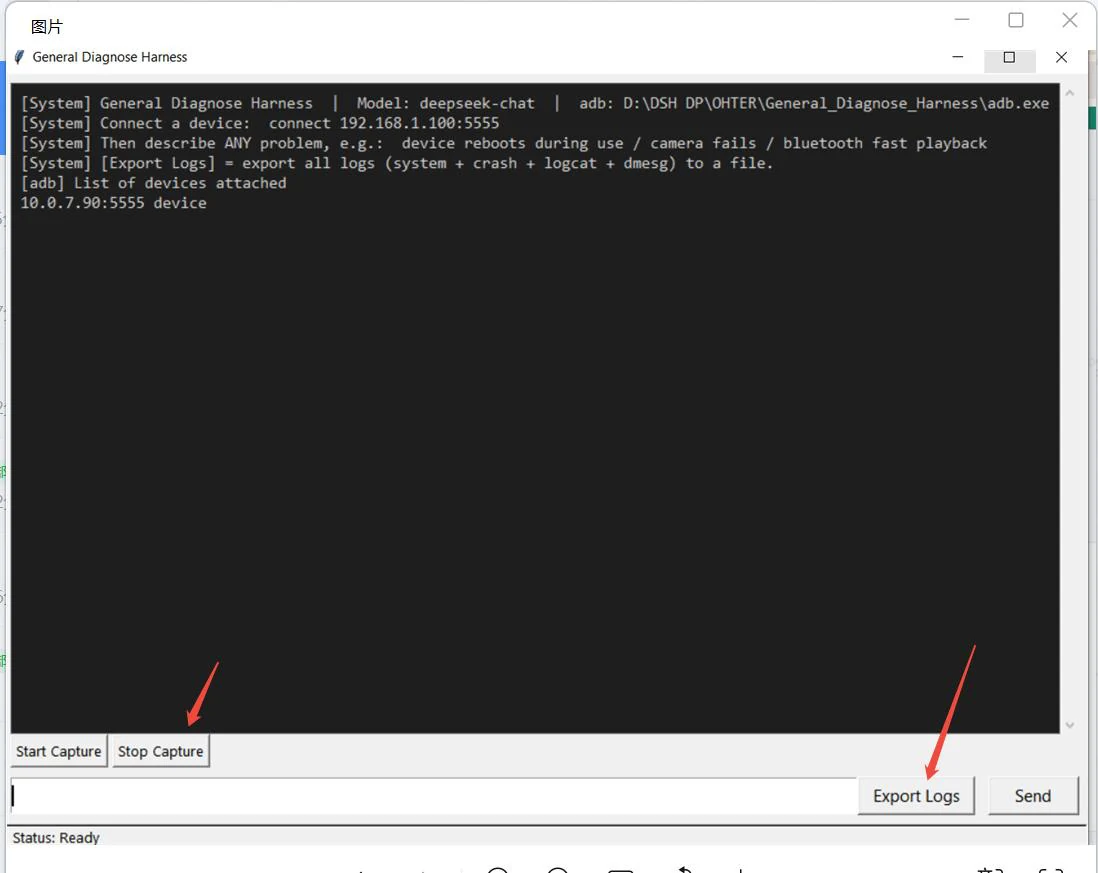
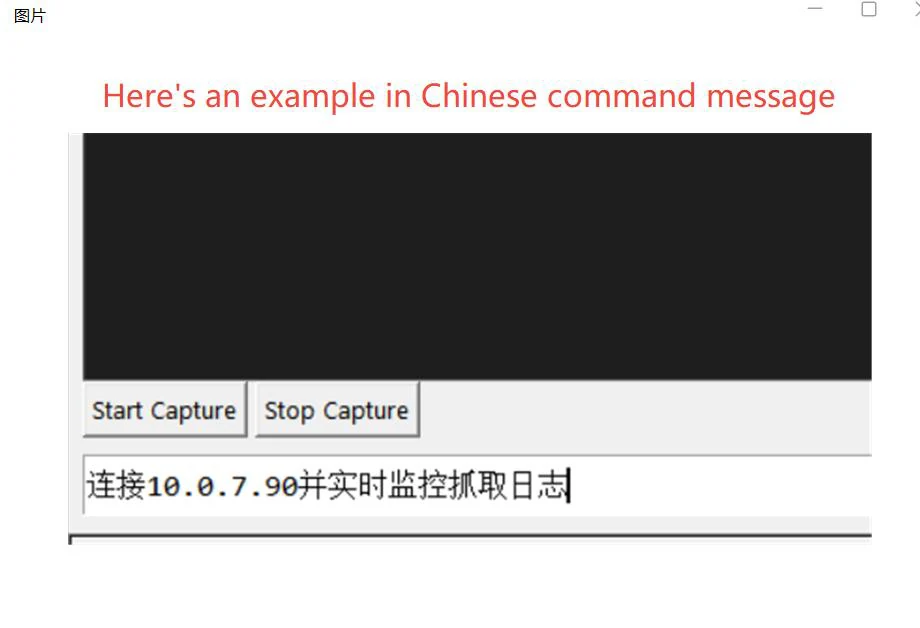
Step 6. Now reproduce the fault. Install and open the fingerprint app, register a fingerprint, then place the same finger on the reader and wait until the failure message appears. Only then click Stop Capture, followed by Export Logs.
Step 7. Copy the exported log file and send it to us. The file is named device_logs_<date>_<time>.txt and lands in the software folder from step 1. One export bundles everything the engineer needs: system log, crash log, logcat and dmesg.
3. Three details that decide whether the capture is usable
A log is only diagnostic if the fault happens inside it. The most common reason a capture comes back useless is that the engineer started the tool, walked away, and exported an empty window of normal operation.
- Keep both devices on the same subnet. Guest Wi-Fi, client-isolated access points and mobile hotspots frequently block device-to-device traffic even though both machines show full signal.
- Re-read the IP if the panel reconnects. Addresses handed out by DHCP change; a panel that rebooted between step 4 and step 5 will not answer on the old address.
- Reproduce while the capture is running, not before. The tool records in real time — starting it after the failure captures the recovery, not the cause.
4. What to send with the log
The log file alone answers “what happened”. These five items answer “on which unit, under which build, and can we reproduce it” — they cut a full email round trip.
| Send this | Why it matters |
|---|---|
| Exported log file | The primary evidence. Keep it unedited and do not rename the .txt extension. |
| Model and serial number | Ties the report to one unit and one production batch. |
| System and app version | Separates a firmware regression from a single-device fault. |
| Exact steps and local time | Lets the engineer line up log timestamps with what you saw. |
| Photo or short video, and repeatability | Shows the symptom when the log itself looks clean. |
5. If the capture does not start
- Connection refused or timeout: the two devices are almost certainly not on the same network, or the IP was mistyped. Check the subnet on both ends before touching the tool.
- The application will not install or will not open: antivirus and endpoint-protection suites sometimes quarantine diagnostic executables. Allow it, or run the capture on a PC without that policy.
- The panel sleeps mid-capture: wake it and keep the screen on for the duration. A panel that drops its Wi-Fi connection during standby also drops the capture.
- Several panels on one network: confirm the IP belongs to the unit in front of you. On a campus with thirty panels this is the second most common cause of a failed capture.
6. What a log can and cannot tell us
A real-time log is strong evidence for software-level behaviour: application exceptions, service crashes, timing problems, failed network calls, and the order in which those events occurred.
It is weak evidence for physical faults. A cracked sensor, a delaminated touch frame, a failing power rail or anything that happens before the operating system starts will not appear in the log. If the panel shows no sign of life at all, a video of the boot sequence and the LED status is more useful than any capture.
Treat the exported file as an internal document. It can contain device identifiers, network addresses and application package names; send it through your normal support channel rather than a public link.
7. FAQ
Does the panel need an internet connection to capture a log?
No. The tool talks to the panel over the local network. Internet access is not required for the capture itself, only the PC and the panel have to reach each other.
Can I run the capture from a Mac or Linux machine?
Not directly — the harness is a Windows executable. Use a Windows PC, or a Windows virtual machine bridged onto the same network as the panel.
How long should a capture run?
Long enough to contain the fault, and no longer. For a fingerprint or app failure that means one or two attempts, usually under five minutes in total.
The IP address is different from last month. Is something wrong?
No. The panel receives its address over DHCP, so it can change when the device reboots or the lease renews. Always read the current address on the panel before connecting.
Can I just send the log over chat?
Email or your usual support channel is safer. Chat applications often compress or cap attachments, and a truncated log is worse than no log because it looks complete.
If the capture cannot be completed on site — a locked-down school network is the usual reason — tell us what the two devices see and we will work through the network side with you rather than ask for a file that cannot be produced. The point of the procedure is a fix, not a formality. If you would rather start from the current firmware or check the published specifications first, both are on the support site, and the RK3576 interactive flat panel data sheet lists the ports referenced above.
Related Product
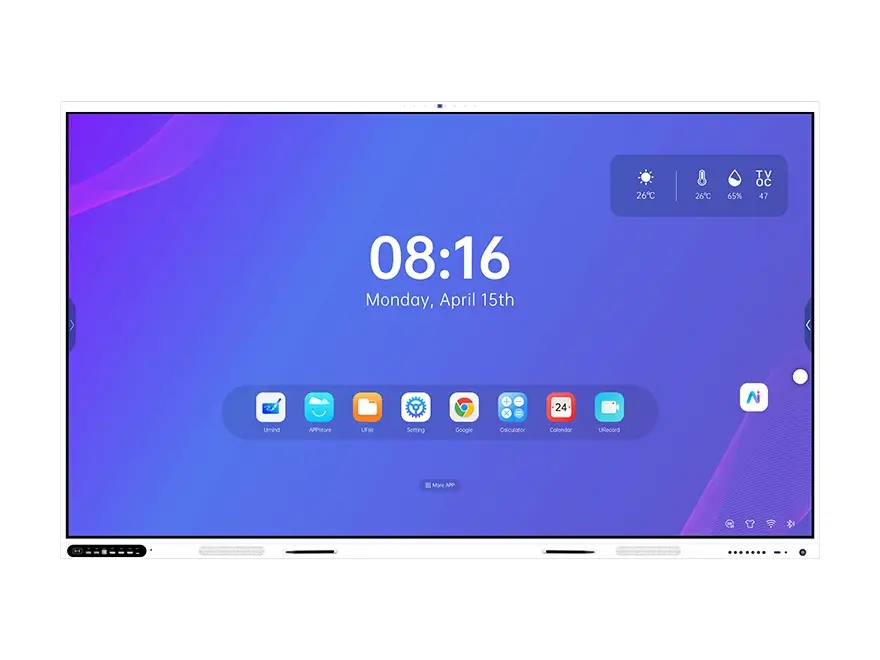
Interactive Flat Panel RK3576
Android 14 interactive flat panel on the RK3576 board, 65″ to 110″, IR touch, DaisyOS whiteboard built in.
View Product →
IFPD OEM / White-label
Own-brand interactive flat panels: your logo, your packaging, your firmware defaults, factory-direct.
View Product →
Education Solution
Classroom deployments at campus scale: panels, OPS modules, CMS and on-site support planning.
View Solution →Related Articles
Suki Wang — Sales Manager
Dong Guan RioTouch Technology Co.,Ltd.
Email: sukiwang@riotouch.com
WhatsApp: +86 137 1299 3879